In SAP NetWeaver Process Integration(PI),we have two different types of approaches for monitoring the various Integration processes.
- Monitoring of an individual PI domain
Monitoring an individual PI installation can be done using the Runtime Workbench.
The Runtime Workbench runs on the Integration Server, but it also allows the monitoring of distributed PI components, such as local Advanced Adapter Engines or proxy runtimes from SAP business systems.
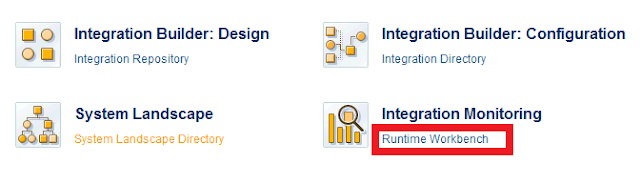
Start the Runtime Workbench from the PI start page of your Integration Server under Configuration and Monitoring → Runtime Workbench or using the url (http://<host>:<port>/dir).
- Monitoring of multiple PI domains
For the monitoring of multiple PI installations, use the PI monitoring in the SAP NetWeaver Administrator.
Start SAP NetWeaver Administrator for PI from the PI start page of your Integration Server (http://<host>:<port>/dir) under Configuration and Monitoring →NetWeaver Administrator.
Different types of Monitoring offered are :
Performance Monitoring
Different types of Monitoring offered are :
- Component Monitoring
- Message Monitoring
- End to End Monitoring and Configuration
- Performance Monitoring
- Index Administration
- Alert Configuration and Alert Inbox
- Cache Monitoring
Component Monitoring
Purpose
Component monitoring is used in the following cases:
- To get an overview of the status of the individual PI components.
- To call the configuration data of individual components.
- To use test messages to check whether the runtime components are functioning correctly.
- To test whether cache connectivity is functioning correctly.
- To archive the Message Security Settings or Whole Messages
- To check the status of your communication channels or the Java Proxy Runtime configured in them.
- To display current technical data for your Adapter Engine.
- If you want to prioritize message processing on your Adapter Engine.
The Runtime Workbench is the central tool for component monitoring and provides you with an overview of the current system landscape. To create this view, component monitoring uses data from the System Landscape Directory, the exchange profile, and from the components themselves.
Process Flow
We use the Runtime Workbench to display and monitor the following components:
- Integration Server including the
- Integration Engine (central)
- Business Process Engine
- Mapping Runtime
- Adapter Engine (central)
- ABAP proxy systems (business systems with an Integration Engine)
- Non-central Adapter Engines
- Java SE Adapter
- System Landscape Directory
- Integration Directory
- Enterprise Services Repository
- The Runtime Workbench itself
We can also run component monitoring with a special CCMS Alert Monitor for PI. We call this either by choosing CCMS or transaction code S_B6A_52000011. The CCMS Monitor returns an alert status in component monitoring for every component.
This status is based on information from the SAP Computing Center Management System (CCMS). It is displayed by means of an icon, which can be red, yellow, green, or gray.
NB : If the CCMS Monitor for PI is not active, all the components are displayed with a gray (undefined) status. The same applies to components that are not monitored by the CCMS Monitor at all.
You can use the CCMS status to limit the number of components that are displayed. This means that the system only displays those components with the selected status (all, red, red and yellow).
Component monitoring provides two views for displaying the components. When you choose Display, the default view is the table view. This view displays all the components maintained in the System Landscape Directory, their current CCMS status, and the name and type of the component.
NB : The system can only display those components that are correctly maintained in the System Landscape Directory.
To switch to the tree view, choose Display as Tree. This view sorts the components by component type.
You can select a component from those displayed and do the following:
- Call information on the current status of the component
- Call information about the configuration of the component
You can also do the following, irrespective of which component is selected:
- Check runtime functions
- Check that cache connectivity is functioning
Message Monitoring
Purpose
You use message monitoring in the following cases:
- To track the status of messages
- To find errors that have occurred and establish what caused them
The central message-monitoring tool is the Runtime Workbench. You can also run message monitoring by using Integration Engine monitoring, which you can call from your SAP Easy Access user menu.
In message monitoring for adapter engines, you can restrict access to the message payload for certain types of messages. To do this, you have to create your own actions and group them into roles. For more information, see SAP Note 1370334.
Prerequisites
You have started the Runtime Workbench and have chosen Message Monitoring on the initial screen.
Process Flow
Message monitoring enables you to use the following functions:
- Display and manage messages
- Displaying the Message Overview
- Searching for messages using an index.
- Filter the displayed messages by specific criteria
- Configure the message display
- Edit messages.
Purpose
You use end-to-end monitoring in the following cases:
- If you want to monitor message processing steps in a number of SAP components (to be configured).
- If you want to monitor the path of individual messages through these SAP components, from start to end.
The central end-to-end monitoring tool is the Runtime Workbench. The data for end-to-end monitoring comes from the Process Monitoring Infrastructure (PMI), which is an SAP monitoring tool for monitoring end-to-end technical processes involving multiple SAP components.
Prerequisites
- You have started the Runtime Workbench.
- You have activated the HTTP services required for PMI by calling transaction SICF or program RSXMB_ACTIVATE_ICF_SERVICES.
Process Flow
If you want to run end-to-end monitoring, proceed as follows:
- Select and configure the components that are relevant for monitoring.
NB : All components involved must have the logon group PUBLIC. - Send the messages whose processing you want to monitor from start to end.
- Choose End-to-End Monitoring on the initial screen of the Runtime Workbench.
- If required, enter filter criteria for the sender and receiver.
Defined selection filters can be saved and reused. Saved filters can also be deleted. - Choose Display.
Result
End-to-end monitoring has two views for displaying the data delivered from PMI for the individual processing steps (technical process steps) of the messages in the configured components:
- The process overview
The process overview displays the total number of processed messages and the number of messages with errors for each component involved. If the number of messages with errors is greater than zero, the status of the component changes from green to red.
The process overview is the initial screen of process monitoring and contains a graphical representation of the components involved in the process. You can open these components and display the process steps involved. - The instance view
The instance view displays the path of a specific message through the components involved. Detailed data is available for each individual processing step in every instance.
The instance view contains a graphical representation of all components involved in the process. It displays the status for each of the components that the instance passes through. You can open the components to display a view of the process steps involved with the corresponding data.
If you choose Further Settings in the left screen area, a window appears containing further information and administrative options for PMI. Among other things you can turn the monitoring on and off here, or immediately update the monitoring data that is displayed. To do this, choose Start Now on the General tab page.
For more information about the integration of PMI into the Runtime Workbench, see Displaying and Managing Process Monitoring. You can also access this information by choosing Help on the left-hand side of the screen.
Selecting and configuring components
Use
You select and configure components for the following reasons:
- As a prerequisite for end-to-end monitoring.
- If you want to use the Process Monitoring Infrastructure (PMI) to compile runtime data and display it in performance monitoring.
The configuration takes place in the Runtime Workbench
Prerequisites
- The monitoring server must be maintained correctly in the exchange profile.
- The components to be selected must be maintained correctly in the System Landscape Directory.
NB : You can select and configure SAP components only.
- Each component requires the user PIRWBUSER.
NB : You can select and configure SAP components only.
Procedure
- On the Runtime Workbench start page, choose Configuration.
- Enter the logon data for the monitoring server.
NB : This step is not necessary if you have set up Single Sign-On for your user. - Choose Display.The system displays the components of your current domain. The Integration Server is selected as the default.
- Select the other components that you want to use and configure them as sender or receiver, or both, depending on the component type.
- Select the monitoring level that you want to use for each of the selected components.The monitoring level determines which tracking agents are activated for the respective component and which monitoring data an active agent delivers.
- If the component is a logical ALE system, you must make the following additional settings:
- If you want to define the logical ALE system as the sender, choose a sender port from the corresponding drop down list box, from which the messages will be sent to the Integration Server.The Select More Ports action appears. If you want to select additional sender ports from another table, choose this action.
- If you want to define the logical ALE system as the receiver, choose a receiver port from the corresponding drop down list box, to which the messages will be sent from the Integration Server.
NB : To be able to select ALE ports, they must have been already defined. More information: Defining Ports
7.Choose Save Configuration.
Monitoring is automatically activated when you save the configuration.
NB : Saving deletes the old configuration and the corresponding monitoring data.
8.If you want to deactivate monitoring, choose Deactivate Monitoring.
Purpose
You use performance monitoring to display statistical data on the performance of message processing. The data comes from the Integration Server (IS) or the Process Monitoring Infrastructure (PMI).
The central performance monitoring tool is the Runtime Workbench.
Prerequisites
- You have configured the necessary data collection from the Integration Server and from PMI for performance monitoring.
- You have started the Runtime Workbench and have chosen Performance Monitoring on the initial screen.
Process Flow
Use performance monitoring to display the following data:
- Aggregated overview data for message processing
- Individual overview data for message processing
- Aggregated detailed data for message processing performance
- Individual detailed data for message processing performance
Use selection criteria to restrict the data that is displayed. For example, you can restrict the data to:
- The data source
- A specific component
- A message processing mode
- A specific time interval
You can also choose Extended Search to restrict the displayed messages by using sender and receiver criteria. Selection filters defined in this way can be saved and reused. Saved filters can also be deleted.
- The overview data offers you a quick insight into the number of messages, for example, that were processed in a specific time period for a specific interface, or for a specific combination of sender/interface and receiver/interface.
- If you want to display detailed data, you must specify a unique sender and unique receiver.
- If you want to display aggregated data, you must specify an aggregation interval.
Index Administration
Purpose
You use the index administration to control and monitor the indexing for the index-based message search.
Prerequisites
The following prerequisites must be fulfilled before you can use the index administration:
- You have set up the communication between your components (Integration Engines and Adapter Engines) and the TREX server.
- You have started the Runtime Workbench and have chosen Index Administration on the initial screen.
- You have the authorizations of role SAP_XI_ADMINISTRATOR.
Process Flow
To manage your indexes, you proceed as follows:
- You administer the indexing for all components that can communicate with the TREX server.
- You specify global parameters that are valid for all components and that are passed to the components when indexing is active.
- You manage filters, which you use to restrict the indexing of messages according to the defined selection criteria.
Administration of Indexing
To work with indexing administration, choose the Index Administration tab page (default setting). The system displays a table listing all the Integration Engines and Adapter Engines maintained in the System Landscape Directory (SLD).
NB : You can index all components that are based on SAP NetWeaver '04 Support Package Stack 15 or higher, or SAP NetWeaver 7.0 Support Package Stack 06 or higher, or SAP NetWeaver 7.1.
The table also provides the following information:
- Status of indexing:
- Green (
 ): Indexing is active and has no errors
 - Yellow (
 ): Indexing is active; warnings exist
 - Red (
 ): Indexing is active; errors exist
 - Grey (
 ): Indexing is not active
 - Red with lightening (
 ): Status is not known; communication with component is not possible
 - Component name
- Type of indexing
- Date and time of the last indexing
- Number of messages available in index
- Date, time, and initiator of last change
- Choose Refresh to refresh the data displayed.
- Select a component and then select:
- Log, to display the log file for the indexing of the selected component.The log is displayed beneath the table and contains detailed information that may be useful if errors occur.
- A return value of -1 indicates that an exception was raised. The exception text is displayed.
- A return value of 0 indicates that no errors have occurred.
- A return value greater than 0 is an error code from TREX. For more information, see SAP Note 898404.
- Details, to display more information about the errors that have occurred for components with a red error status ().
- Type of indexing
If you select fast instead of standard indexing, certain analysis steps are skipped, which speeds up indexing considerably.
- Activate, to activate the set indexing and create an index for the selected component.
- Deactivate, to deactivate the set indexing and delete the index for the selected component.
- A date in the Delta Indexing From field; a delta indexing is to be performed for the selected component for the time period starting from this date up to the current date.
- Start, to start the delta indexing from the selected date.
Global Settings
The global settings are on the Global Settings tab page. Global parameters are parameters that are valid for all components. They are passed to the relevant components when indexing is activated, and control the indexing of messages on these components. Each parameter has a default setting, which you should only change if required; you can restore the default settings for parameters at any time. The following parameters are available:
- Maximum number of messages per package to be transferred to the TREX server
When you activate indexing, an indexing service is scheduled, which uses a background job to periodically transfer any new or changed messages in packages to the TREX server for indexing. - Maximum size in KB of message packages transferred to the TREX server
- Time interval in minutes for the periodic transfer of message packages to the TREX server for indexing
- Time interval in hours for the periodic reorganization of the index of a component on the TREX server
A reorganization service is scheduled after the messages are transferred to the TREX server; this reorganization service deletes messages from the index after a specific, preconfigured retention period. - Time period in days for the retention period of messages in the index
- Time interval in minutes for the periodic processing of the TREX queue
When the TREX server receives the data, it stores it in a queue. A TREX queue is an index, which is periodically processed and which triggers the indexing of messages. - Maximum number of entries for processing in the TREX queue
Selection Filters
You can create (and delete) filters to restrict the indexing of messages according to the specified selection criteria. If the filter is left empty, all messages on a component are indexed.
You can specify the following sender and receiver attributes as selection criteria:
- Party
- Component
- Interface name
- Interface namespace
All fields permit generic entries with an asterisk (*): Input help is available.
The values of the Interface Name and Interface Namespace attributes are combined with OR and applied to both interfaces (sender and receiver interfaces).
If you create multiple filters, these are combined with OR and identify the messages to be indexed.
When you save a filter, it is applied to all components on which message indexing is active.
Alert Configuration
Purpose
You use the alert configuration to have the system inform you of errors during message processing. You can receive the alert by e-mail, fax, or SMS. In each case you will also find the alert in your alert inbox.
Prerequisites
You have fulfilled the prerequisites and performed the steps listed in Alert Notification Step-by-Step so that you can proceed with the alert configuration settings.
Process Flow
To configure your alerts, proceed as follows:
- Create the alert categories that you want to use in your alert rules.
- Create the alert rules in which you want to use your alert categories.
The following options are also available:
- Using various properties of the XPI Service: AF CORE, you can also control the connection of alerts from the Adapter Framework to the central monitoring server.
- Alerts from the Integration Engine are sent using the RFC destination CentralMonitoringServer-XIAlerts to the central monitoring server.This destination is created automatically as soon as the first alert is sent from the Integration Engine. The required technical settings and logon information are read from the exchange profile.
- You can configure a connection to CCMS and schedule the periodic transfer of alerts to CCMS.Once you have configured the connection to CCMS, choose Show CCMS Connection, select a period, and start the periodic transfer.A background job is scheduled that collects all unprocessed alerts and forwards the data to CCMS. You can also stop this job.
The transferred data is displayed in a special CCMS Monitor. - You can use the report SXMSALERT_LOGREADER to display log information for alerts that were reported by PI components. The report also shows whether an alert rule was found or not.
Alert Inbox
Use
The alert inbox is user-specific and displays all the alerts for each alert server that have been generated based on the alert configuration.
An alert can be delivered to you by e-mail, fax, or SMS. In each case, you will also find the alert in your alert inbox, irrespective of the delivery method.
Integration
You can also call the alert inbox directly by calling transaction ALRTINBOX.
Prerequisites
- You have set up a central alert server.
- You have created alert rules.
- You have chosen Alert Inbox on the initial screen of the Runtime Workbench.
Activities
You can execute the following activities in your alert inbox:
- Confirm alerts and start a follow-up actionConfirmed alerts disappear from the inbox. You can also confirm alerts by e-mail, fax, or SMS. This also causes them to disappear from your alert inbox.
- Forward alerts to another user.
- Refresh the alert display.
- Subscribe or unsubscribe to the alert categories that you are permitted to use, in order to receive or not receive the corresponding alerts.
- Personalize alert delivery to meet your requirements.You can choose the type of delivery you want to use and a representative.
Cache Monitoring
Purpose
Cache monitoring displays objects that are currently in the runtime cache of either of the following receivers (cache instances) of cache data:
- Integration Server (ABAP Cache)
- Adapter Engine (Central and Local)
- Mapping Runtime Cache (Adapter Engines)
- Business Systems (with Web Service Communication)
Prerequisites
You have started the Runtime Workbench and have chosen Cache Monitoring on the initial screen.
Process Flow
In cache monitoring, different cache objects are monitored depending on the cache instance concerned. Selection criteria are available for each cache object; you can use these selection criteria to search for current objects in the runtime cache.
A table of hits is displayed. The content of this table varies depending on the cache object you have selected.
For most cache objects, you can display details for individual hits from the hit list. To do this, select the radio button in the first column of the relevant line.
Regardless of which cache object you select, you always have the option of calling a Notification Table that displays information about runtime cache updates and any problems that arose.
A Status Table lets you display the status of the last cache update for each cache instance.


